背景 随着公司业务的不断扩展 ,系统也变得越来越臃肿,需要被不断的拆分,引进诸如微前端这样的框架,开发人员也不断的扩充,甚至有不同办公地点的同事协作开发。除了基本的开发规范外,也需要有一套完善的监控来测试和记录每次代码提交是否比之前版本存在性能不足等问题,在 CI 阶段发现问题,提早解决避免上线后带来性能损失而流失用户。团队成员也能在工作中不断的成长、驱动、交付出优质的应用。
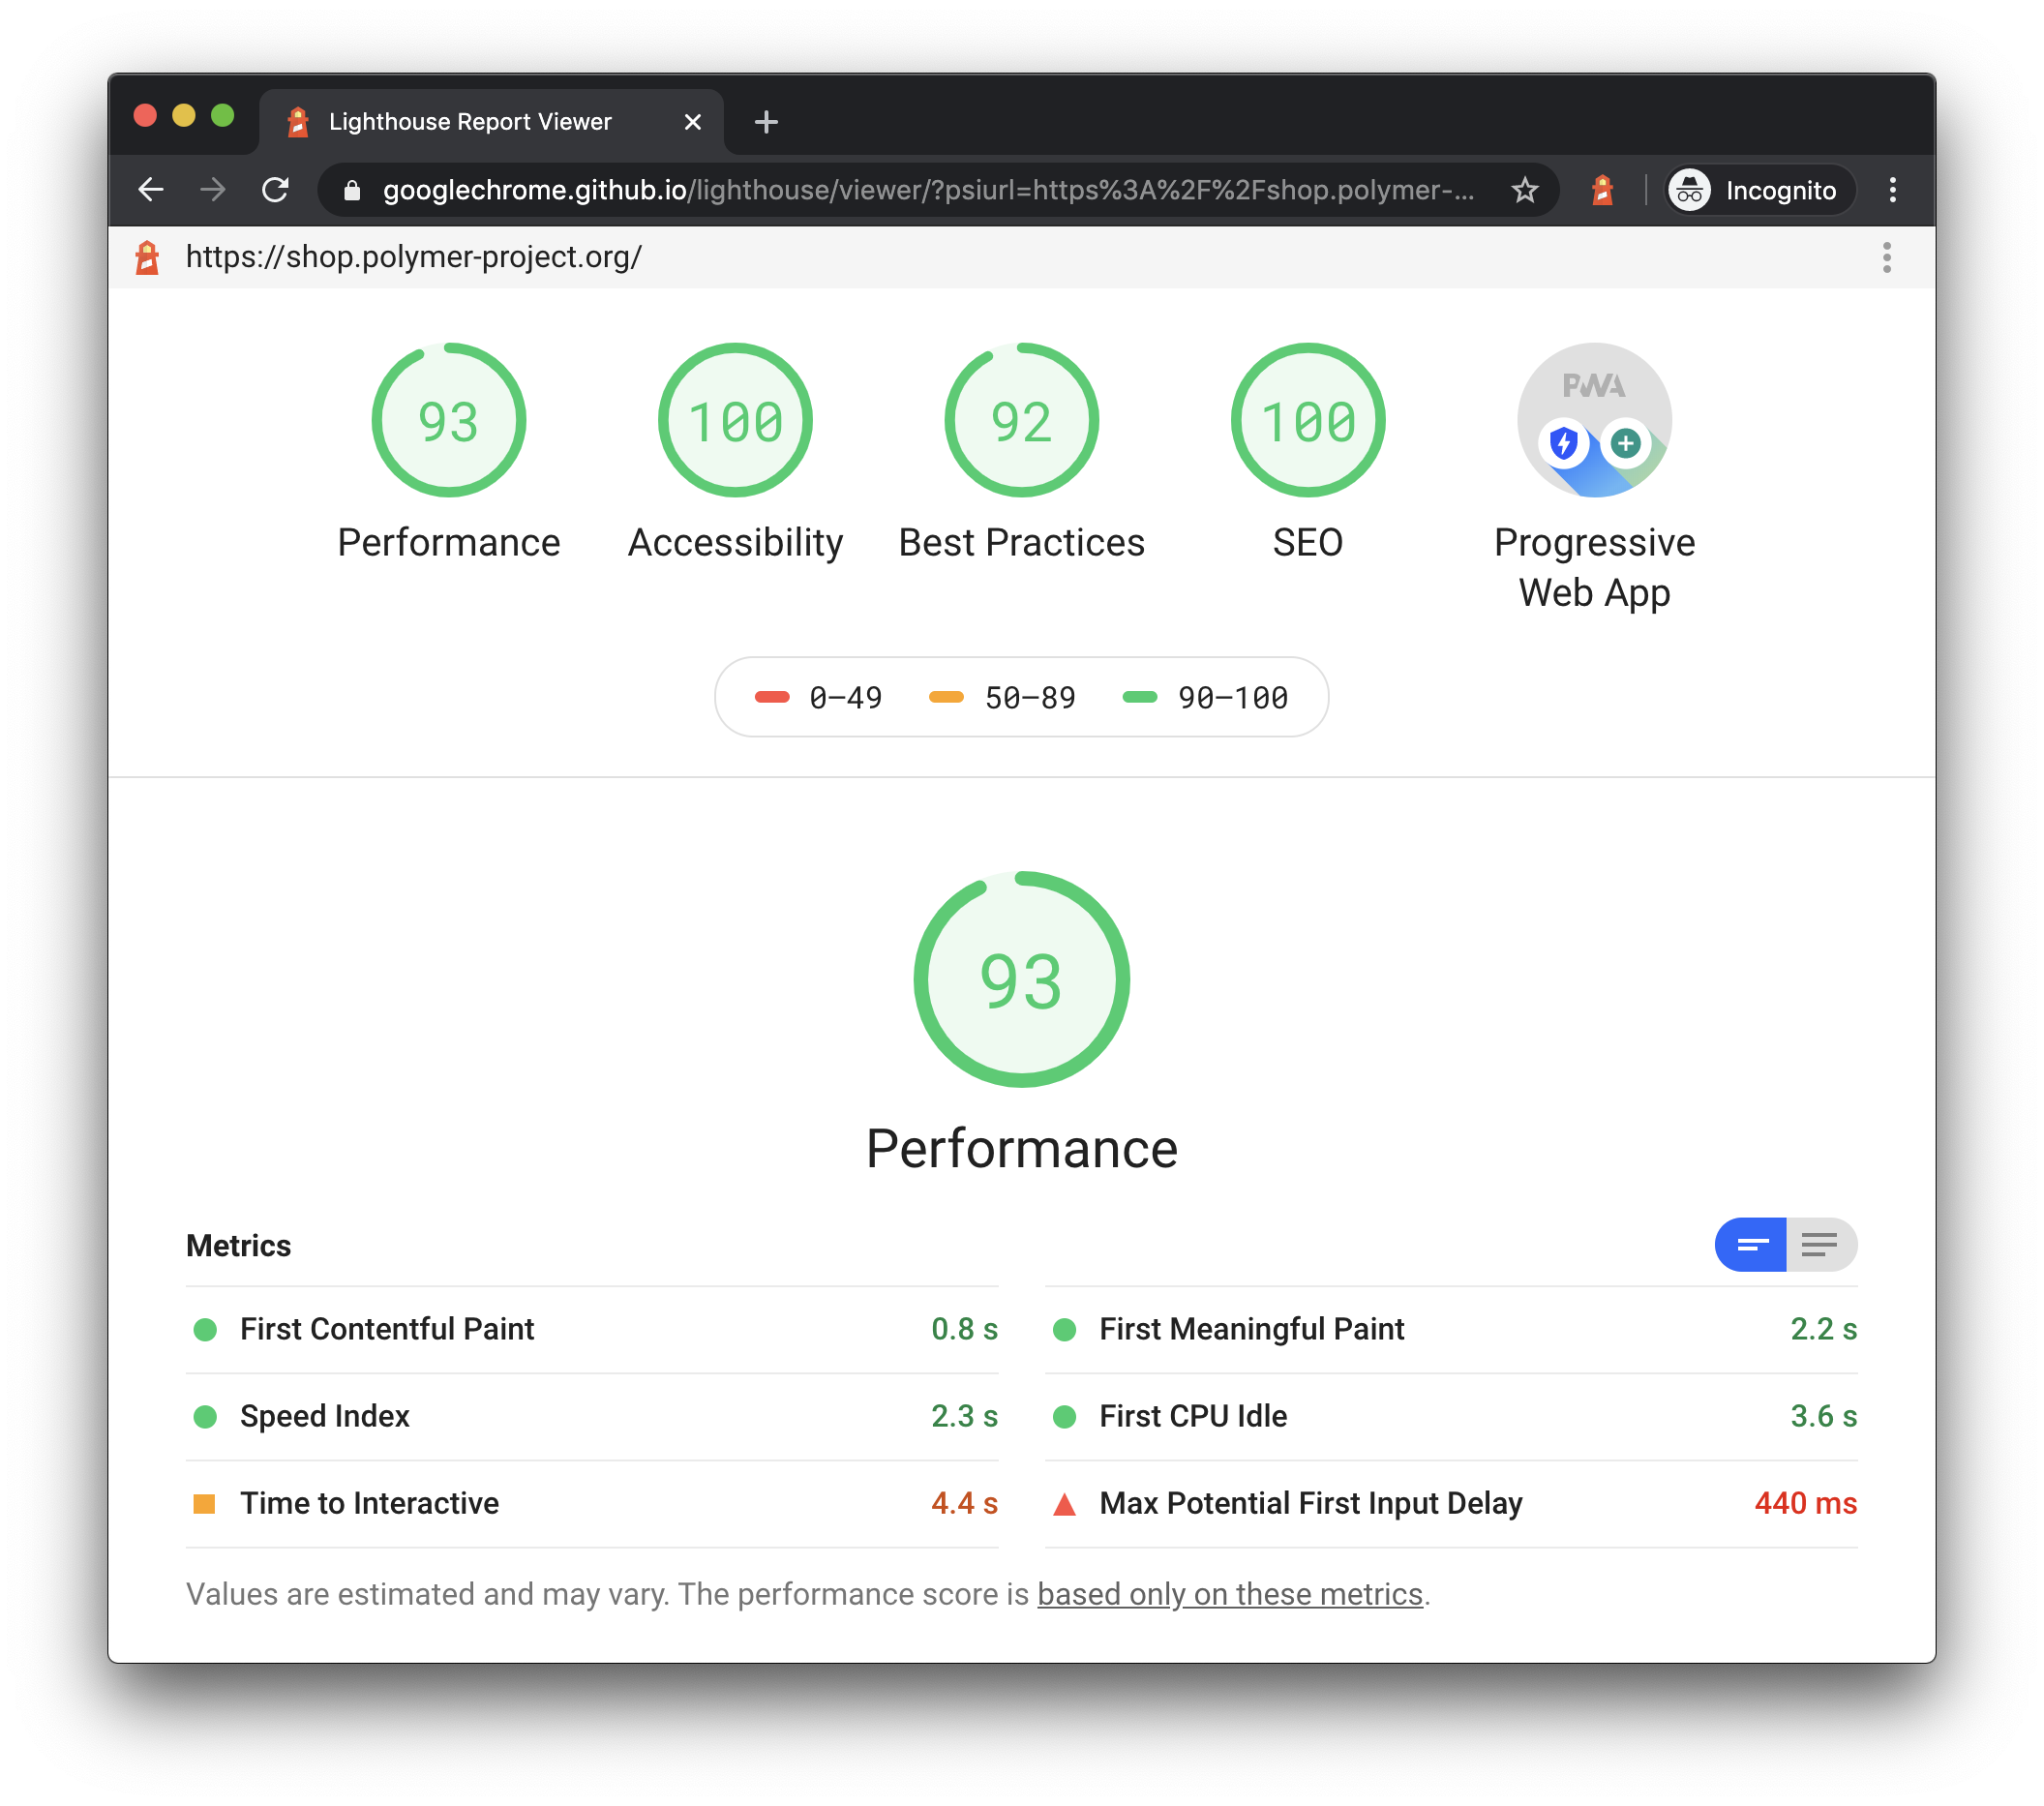
前端经常要关注的几个指标: First Contentful Paint: 浏览器首次绘制文本、图片(包含背景图)、非白色的 canvas 或 SVG 的时间节点。反映了网络的可用性和页面资源是否庞大导致传输时间过长。
First Meaningful Paint: 页面的“主要内容”开始出现在屏幕上的时间点,测量用户加载体验的主要指标。反映了是否太多非重要资源加载或执行的优先级高于主要的呈现资源。
First CPU Idle: 页面主线程首次可以触发 input 操作,通常叫做最小可交互时间。
Time to Interactive: 页面完全达到可交互状态的时间点。
Lighthouse 介绍
是一个开源的自动化工具,用于改进网络应用的质量。 您可以将其作为一个 Chrome 扩展程序运行,或从命令行运行。 您为 Lighthouse 提供一个您要审查的网址,它将针对此页面运行一连串的测试,然后生成一个有关页面性能的报告。
原理分析
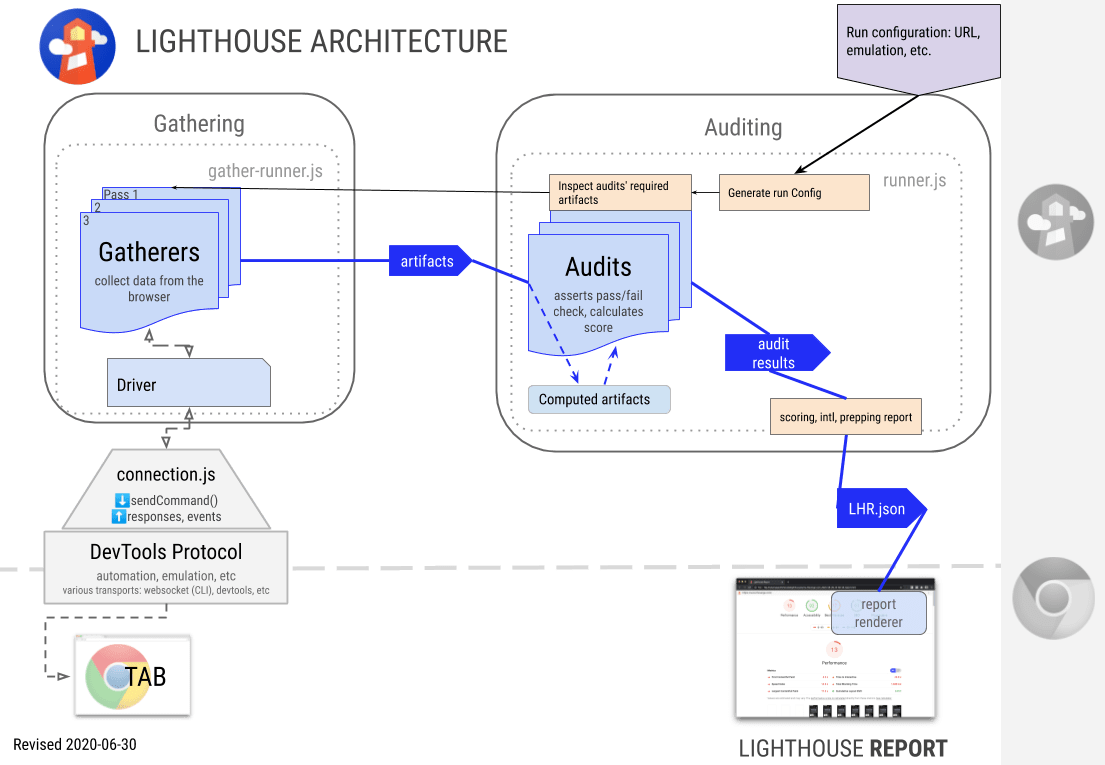
Driver: 和 Chrome 交互的对象
Gatherers: 收集网页的一些基础信息,用于后续的 Audit
Artifacts: 一系列 Gatherers 的信息集合
Audit: 测试单个功能/优化/指标。用 Artifacts 作为输入,计算出该项指标的得分,生成Lighthouse 标准的数据对象
Report: 根据 Lighthouse 标准的数据对象生成可视化页面
Lighthouse 通过 Driver 模块用 DevTools Protocol 与 Chrome 通信,按照需求对其进行操作,在 Gatherers 模块收集一些信息(artifacts),在 Audits 模块中进行计算,得到最终打分结果,生成 LHR 根式的报告,渲染成 HTML 文件。
Lighthouse CI 官方示例
1
2
3
4
5
6
7
8
9
10
11
name: CI on: [push ]jobs: lighthouseci: runs-on: ubuntu-latest steps: - uses: actions/checkout@v2 - uses: actions/setup-node@v1 - run: npm install && npm install -g @lhci/cli@0.4.x - run: npm run build - run: lhci autorun --upload.target=temporary-public-storage
collect 命令源码分析
@lhci/cli 版本 0.4.x
1 2 3 4 5 6 7 8 9 10 11 12 13 14 15 16 17 18 19 20 21 22 23 24 25 26 27 28 29 30 31 32 33 async function runCommand (options ) { const healthcheckStatus = runChildCommand ("healthcheck" , [ ...defaultFlags, "--fatal" , ]).status ; const collectStatus = runChildCommand ("collect" , [ ...defaultFlags, ...collectArgs, ]).status ; if ( ciConfiguration.assert || (!ciConfiguration.assert && !ciConfiguration.upload ) ) { const assertStatus = runChildCommand ("assert" , [ ...defaultFlags, ...assertArgs, ]).status ; } if (ciConfiguration.upload ) { const uploadStatus = runChildCommand ("upload" , defaultFlags).status ; if (options.failOnUploadFailure && uploadStatus !== 0 ) process.exit (uploadStatus); if (uploadStatus !== 0 ) process.stderr .write (`WARNING: upload command failed.\n` ); } }
从上述代码中可以很直观看到 autorun 里面包含的命令
healthcheck 一些检查,比如是否安装了 Chrome、客户端版本和服务端版本是否一致等等
collect 重要命令,它的整个流程基本涵盖了架构图,从信息的采集到生成报告
assert 性能分析是否通过,会有相关的提示
upload 上传报告到指定的服务器,上面例子的上传目标是 temporary-public-storage,一个 google 提供的临时公共服务器
1
2
3
4
5
6
7
8
9
10
11
12
13
14
15
16
17
18
19
20
21
22
23
24
25
26
27
28
29
30
31
32
33
34
async function runCommand (options ) { if (!options.additive ) clearSavedReportsAndLHRs (); checkIgnoredChromeFlagsOption (options); const puppeteer = new PuppeteerManager (options); const { urls, close } = await startServerAndDetermineUrls (options); for (const url of urls) { await puppeteer.invokePuppeteerScriptForUrl (url); await runOnUrl (url, options, { puppeteer }); } } async function runOnUrl (url, options, context ) { const runner = getRunner (options); for (let i = 0 ; i < options.numberOfRuns ; i++) { const lhr = await runner.runUntilSuccess (url, { ...options, settings, }); saveLHR (lhr); } }
puppeteer :一个通过 DevTools Protocol 操控 Headless Chrome 的 Node.js 类库numberOfRuns 默认是 3,会分别开启 3 个 Node.js 进程各走一次流程,最后在 .lighthouseci 目录下生成 3 对 lhr-xxx.json 和 lhr-xxx.html 文件(前者是分析结果,后者是渲染的网页),及一个 assertion-results.json 文件
runUntilSuccess 开始执行 lighthouse-cli 里的逻辑
1 2 3 4 5 6 7 8 9 10 11 12 13 14 15 16 17 async function runLighthouse (url, flags, config ) { let launchedChrome; launchedChrome = await getDebuggableChrome (flags); flags.port = launchedChrome.port ; const runnerResult = await lighthouse (url, flags, config); if (runnerResult) { await saveResults (runnerResult, flags); } return runnerResult; }
在 lighthouse-cli 中主要就是启动一个 headless Chrome(无界面的 Chrome),后续交由 lighthouse-core 核心模块完成。
1 2 3 4 5 6 7 8 9 10 11 12 13 14 15 16 17 18 19 20 21 22 23 24 25 26 27 28 29 30 31 32 33 34 35 36 37 38 39 40 41 42 43 44 45 46 47 48 49 50 51 52 53 54 55 56 57 58 59 60 61 62 async function lighthouse (url, flags = {}, configJSON, connection ) { const config = generateConfig (configJSON, flags); const connection = connection || new ChromeProtocol (flags.port , flags.hostname ); return Runner .run (connection, { url, config }); } async function run (connection, runOpts ) { artifacts = await Runner ._gatherArtifactsFromBrowser ( requestedUrl, runOpts, connection ); const auditResults = await Runner ._runAudits ( settings, runOpts.config .audits , artifacts, lighthouseRunWarnings ); const lhr = { }; lhr.i18n .icuMessagePaths = i18n.replaceIcuMessageInstanceIds ( lhr, settings.locale ); const report = generateReport (lhr, settings.output ); return { lhr, artifacts, report }; } async function _gatherArtifactsFromBrowser ( requestedUrl, runnerOpts, connection const driver = runnerOpts.driverMock || new Driver (connection); const gatherOpts = { driver, requestedUrl, settings : runnerOpts.config .settings , }; const artifacts = await GatherRunner .run ( runnerOpts.config .passes , gatherOpts ); return artifacts; }
上述代码的逻辑非常清晰,就是根据现有数据(artifacts),计算出结果数据(audits),生成报告。
如何得到 artifacts 这些信息的呢? 1 2 3 4 5 6 7 8 9 10 11 12 13 14 15 16 17 18 19 20 21 22 23 24 25 26 27 28 29 30 31 32 33 34 35 36 37 38 39 40 41 42 43 44 45 46 47 48 49 50 51 52 53 54 55 async function run (passConfigs, options ) { const artifacts = {}; const driver = options.driver ; await driver.connect (); await GatherRunner .loadBlank (driver); const baseArtifacts = await GatherRunner .initializeBaseArtifacts (options); baseArtifacts.BenchmarkIndex = await options.driver .getBenchmarkIndex (); await GatherRunner .setupDriver (driver, options); for (const passConfig of passConfigs) { const passContext = { driver, url : options.requestedUrl , settings : options.settings , passConfig, baseArtifacts, LighthouseRunWarnings : baseArtifacts.LighthouseRunWarnings , }; const passResults = await GatherRunner .runPass (passContext); Object .assign (artifacts, passResults.artifacts ); } return { ...baseArtifacts, ...artifacts }; } class Gatherer { get name () { return this .constructor .name ; } beforePass (passContext ) {} pass (passContext ) {} afterPass (passContext, loadData ) {} }
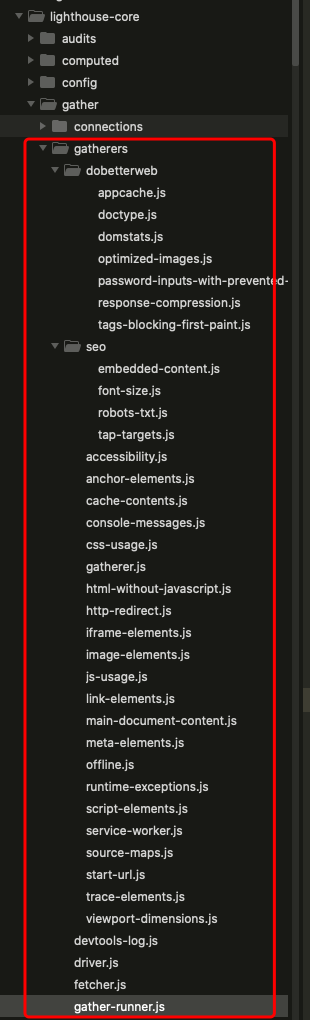
runPass 是一个重要的生命周期,如果要给 Lighthouse 写自定义的扩展,必须要了解它。其实就是模拟人的行为,打开空网页(loadBlank),设置网络参数(setupPassNetwork),情况缓存(cleanBrowserCaches),beforePass(注入页面加载前注入脚本获取关键信息),beginRecording(页面加载前记录 devtoolsLog 和 trace),pass(页面加载中),endRecording(页面加载结束记录 devtoolsLog 和 trace),afterPass(页面加载结束注入脚本获取关键信息),collectArtifacts(收集相关信息)。其中,beforePass、pass 和 afterPass 在写自定义 gather 时可以注入脚本获取自己需要的信息的,非常有用。最后将收集的信息挂载到 artifacts 上。系统内置的信息收集类都在 lighthouse-core 下的 gather/gatherers 目录里。
以收集图片信息的 ImageElements 为例,它对外暴露了 afterPass 接口,是一个经典应用
1 2 3 4 5 6 7 8 9 10 11 12 13 14 15 16 17 18 19 20 21 22 23 24 25 26 27 28 29 30 31 32 33 34 35 36 37 38 39 40 41 42 43 44 45 46 47 48 49 50 51 52 53 54 55 56 57 class ImageElements extends Gatherer { async afterPass (passContext, loadData ) { const driver = passContext.driver ; const indexedNetworkRecords = loadData.networkRecords .reduce ( (map, record ) => { if ( /^image/ .test (record.mimeType ) && record.finished && record.statusCode === 200 ) { map[record.url ] = record; } return map; } ); const expression = `(function() { ${pageFunctions.getElementsInDocumentString} ; // define function on page ${getClientRect.toString()} ; ${getHTMLImages.toString()} ; ${getCSSImages.toString()} ; ${collectImageElementInfo.toString()} ; return collectImageElementInfo(); })()` ; const elements = await driver.evaluateAsync(expression); const top50Images = Object .values (indexedNetworkRecords) .sort ((a, b ) => b.resourceSize - a.resourceSize ) .slice (0 , 50 ); const imageUsage = []; for (let element of elements) { } return imageUsage; } } function determineNaturalSize (url ) { return new Promise ((resolve, reject ) => { const img = new Image (); img.addEventListener ("error" , (_ ) => reject (new Error ("determineNaturalSize failed img load" )) ); img.addEventListener ("load" , () => { resolve ({ naturalWidth : img.naturalWidth , naturalHeight : img.naturalHeight , }); }); img.src = url; }); }
所有 afterPass 方法是在页面加载完后执行的,所以会比 beforePass 多一个loadData参数,记录了网络加载的数据,比如,图片。
在 ImageElements 中
先找出所有正常加载的图片
expression,定义一个闭包,将相关需要用到的方法通过字符串的形式拼接起来,再用 driver.evaluateAsync 将它们注入到 Chrome, 并执行
按照尺寸大小排序,获取最大的前 50 个图片信息
elements 和 top50Images,进行相关的逻辑处理获取图片的原始尺寸,最后返回结果集 imageUsage
从上述代码我们可以知道,将 JavaScript 方法通过 driver.evaluateAsync 注入到 Chrome 里并执行,收集页面的信息。
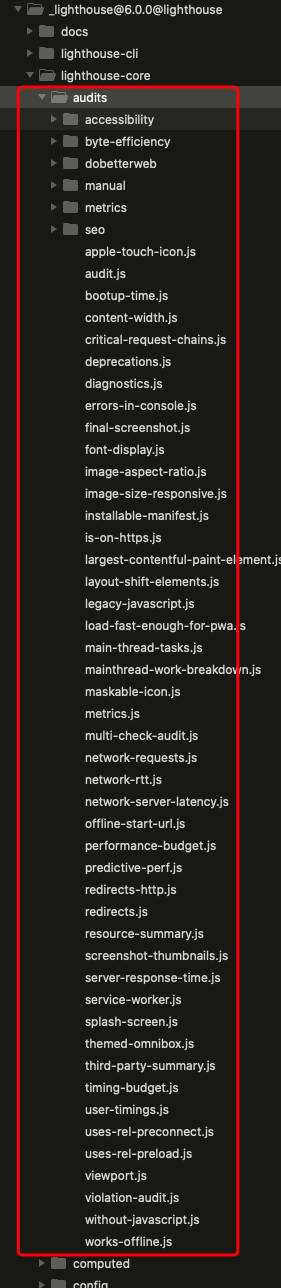
有了信息,该如何计算呢? 系统内置的计算类都在 lighthouse-core 下的 audits 目录里。整体的流程和 gather 很像,都是遍历配置里的集合,然后触发暴露的方法(此处是 audit),然后合并输出,大概过程如下。
1 2 3 4 5 6 7 8 9 10 11 12 13 14 15 16 17 18 19 20 21 22 23 24 25 26 27 28 29 30 31 32 33 34 35 36 37 38 39 40 41 42 43 44 45 46 47 48 49 50 51 52 53 54 const auditResults = await Runner ._runAudits ( settings, runOpts.config .audits , artifacts, lighthouseRunWarnings ); async function _runAudits (settings, audits, artifacts, runWarnings ) { for (const auditDefn of audits) { const auditResult = await Runner ._runAudit ( auditDefn, artifacts, sharedAuditContext, runWarnings ); auditResults.push (auditResult); } return auditResults; } async function _runAudit ( auditDefn, artifacts, sharedAuditContext, runWarnings const audit = auditDefn.implementation ; let auditResult; const auditOptions = Object .assign ( {}, audit.defaultOptions , auditDefn.options ); const auditContext = { options : auditOptions, ...sharedAuditContext, }; const product = await audit.audit (narrowedArtifacts, auditContext); auditResult = Audit .generateAuditResult (audit, product); return auditResult; } class Audit { static audit (artifacts, context ) { throw new Error ("audit() method must be overriden" ); } }
我们依旧以图片的为例。
1 2 3 4 5 6 7 8 9 10 11 12 13 14 15 16 17 18 19 20 21 22 23 24 25 26 class ImageSizeResponsive extends Audit { static audit (artifacts ) { const DPR = artifacts.ViewportDimensions .devicePixelRatio ; const results = Array .from (artifacts.ImageElements ) .filter (isCandidate) .filter (image =>imageHasRightSize (image, DPR )) .filter ( image =>isVisible (image.clientRect , artifacts.ViewportDimensions ) ) .map (image =>getResult (image, DPR )); const headings = [ ]; const finalResults = return { score : Number (results.length === 0 ), details : Audit .makeTableDetails (headings, finalResults) }; } }
gather 和 audit 是核心的流程和概念,上文我们已经简单的分析了整个代码,从 2 者的目录结构图也不难发现 audit 数量远远大于 gather,这也是为什么 2 者分开的重要原因,audit 通过 artifacts 去获取自己想要的数据再进行逻辑计算,增加了 gather 数据的复用性,和各自的扩展性,各个模块的测试也变得容易。
总结 Lighthouse 是一个非常有用的前端性能评测工具,本文主要讲的基础概念,后续将介绍 puppeteer 的使用,如何利用 gather 和 audit 自定义性能监控指标。另外对内置的 gather 和 audit 研究也能极大争强自己对前端的认知,对 Driver 的学习能增加对 DevTools 和 Chrome 的新认知,非常值得深挖。
Comments